Main Investigators
Bahador Saket
Alex Endert
Sponsors National Science Foundation
Publications
InfoVis 2017
|
TVCG 2018
InfoVis 2018
|
EuroVis 2019
CG&A2019
|
InfoVis 2019
Talks
InfoVis Talk
TRIPODS Southwest Talk
Videos
VisExemplar
Liger
Source Code Fork on Github
Status Ongoing
Motivation
As data grow in size and complexity it is difficult for humans to make sense of data in their raw form. To address this challenge, one powerful approach is to visualize data. A key component of visualization systems that helps human sensemaking is its interactivity. Thoughtfully designed interactions make the visual analysis process a conversation between the user and the interface that results in a deeper understanding of data. Yet, despite decades of research, existing visualization systems still require users to interact through layers of menus on control panels. Such systems expect users to adapt their mental model into an algorithmic process by requiring them to: 1) break their higher-level goals to a set of lower-level system specifications (e.g., specify different data mappings), and 2) go through layers of menus in a sequential order to execute those lower-level specifications. The irony of the situation is that the burden of transforming the user's higher-level goals to the system's lower-level specifications and creating visualizations is carried by the user, not the system. This burden of specification hinders the data analysis process for all users, visualization novices in particular. It is a truism that computers are good at performing tedious tasks. So why is it that users need to go through a cumbersome process of specifying a variety of parameters through layers of menus?
Visualization by Demonstration
Conveying a process or an outcome to someone by demonstration might be one of the oldest forms of communicating one's knowledge and intentions in apprenticeship-style learning contexts. People are effective in communicating their intended goals and results by gesturing, drawing visuals, and other forms of demonstration to guide someone else through the intended results. My research extends the demonstrational paradigm to visualization construction and visual data exploration in a method called Vis by Demo. With this paradigm, users directly manipulate~\cite{Hutchins:1985} the visual representation to provide visual demonstrations of their intent to the system. The system then interprets the given demonstrations and recommends potential specifications to the users. Vis by Demo aims to empower the user during the data analysis process by balancing the responsibility between the user and the system --- users provide visual demonstrations, and based on this, the system infers potential specifications and then provides concrete recommendations.
Imagine an HIV researcher who wants to cluster her patients' dataset to derive meaningful patterns and relationships. By skimming through her data, she notices that two of her patients have the same cell decline level (CD4) of 67 (see Figure1-LeftTop). She wonders which other patients fall into the same group as these two patients. She drags the two data points representing these two patients onto the canvas to demonstrate her interest in finding cluster configurations that locate them together. Based on this demonstration, the system provides recommendations for different clustering results for the entire dataset (see Figure1-Middle). Among all recommendations, she selects the recommendation that clusters the data based on combination of both gender and ethnicity features. The resulting visualization converges with her prior knowledge that hispanic males have an average CD4 level of 60 (see Figure1-RightBottom).
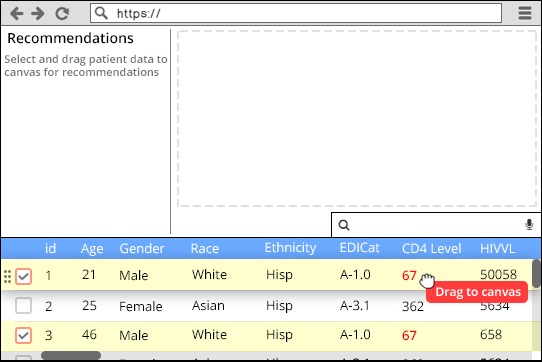
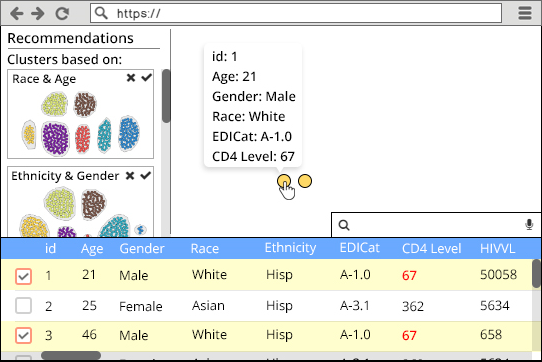
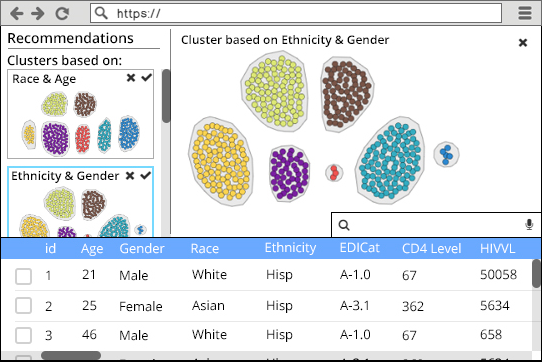
Figure 1: Left:Top: The user selects a sample of data points and drags them to the canvas. Middle: Interface infers clustering results based on the given demonstration. Right:Bottom: User selects a recommendation and gains insight.
While Vis by Demo can infer the user's intent based on manipulating a sample of the dataset, traditional data visualization tools expect the user to explicitly specify relevant data points --- this involves a series of tedious parameterizations through control panels. Additionally, through the recommendations, Vis by Demo supports the user's basic intent by providing new and complex representations of the data. This paradigm empowers both users with low proficiency in traditional tools as well as users with limited knowledge in data science methods (e.g., clustering).